Rank Sum test
Wilcoxon Rank Sum Test
Let's start with a simple example. A set of measurements is collected from two different groups: group A and group B.
group_A = c(2, 3)
group_B = c(4, 5)
We want to determine whether the measurements from each group come from the same distribution or from different distributions. To assess this, we can use the Wilcoxon Rank Sum Test, which tests the null hypothesis that both groups are drawn from the same distribution.
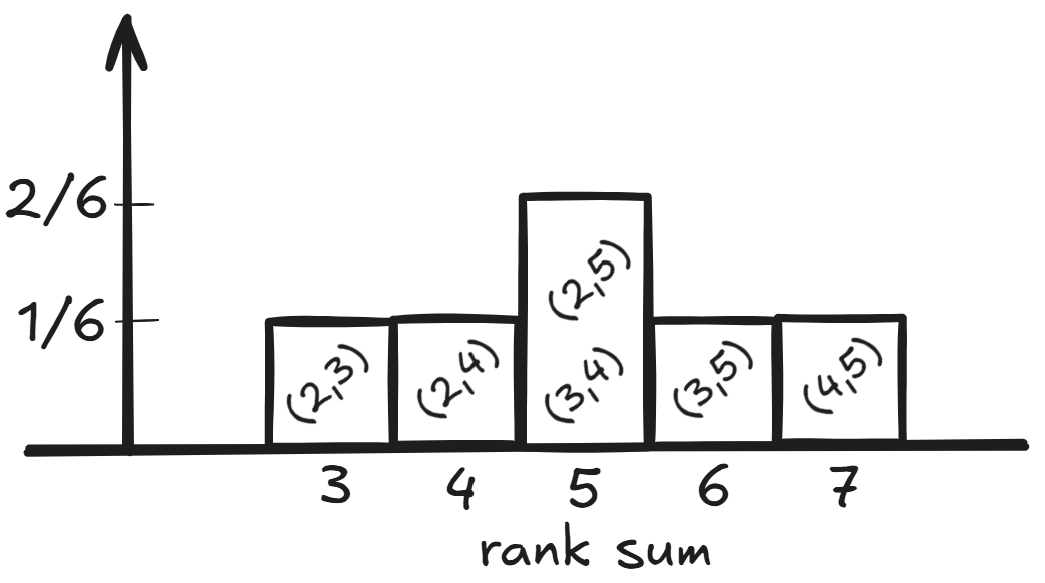
For example, suppose we have a distribution that generates the values 2, 3, 4, and 5. We will assign ranks to these values in ascending order.
| value | rank |
| 2 | 1 |
| 3 | 2 |
| 4 | 3 |
| 5 | 4 |
If two values are selected randomly from {2, 3, 4, 5}, we can calculate the rank sum. For example, the rank sum of group A above is 3 and the group B has the rank sum of 7. The mean rank sum value would be 5. The key idea is that when the values are drawn from the same distribution, ranks are more likely to be mixed between the groups, producing a rank sum close to the expected mean. However, if the ranks are less mixed—leading to rank sums that are significantly lower or higher than the mean—it suggests that the groups may come from different distributions, providing reason to question the null hypothesis.
We can perform wilcox.test() this in R .
group_A = c(2, 3)
group_B = c(4, 5)
wilcox.test(group_A, group_B, exact=TRUE, alternative = "two.sided")$p.value
[1] 0.3333333
Here, the p-value was the probability of having the rank sum of 3 or 7.
What would be the p-value if the data was {(2, 4), (3, 5)}? I think it would be 0.66667. Let’s see.
group_A=c(2,4)
group_B=c(3,5)
wilcox.test(group_A, group_B, exact=TRUE, alternative = "two.sided")$p.value
[1] 0.6666667
Here, the p-value is the probability of having the rank sum of 3, 4 , 6 or 7.
What about one sided?
group_A=c(2,4)
group_B=c(3,5)
wilcox.test(group_A, group_B, exact=TRUE, alternative = "less")$p.value
This would be 0.33333, the probability of having the rank sum of 3 or 4.
The other direction?
group_A=c(2,4)
group_B=c(3,5)
wilcox.test(group_A, group_B, exact=TRUE, alternative = "greater")$p.value
This would be 0.83333, the probability of having the rank sum of 4 ~ 7.
In fact, the full result for two.sided looks like this.
print(wilcox.test(group_A, group_B, exact=TRUE, alternative = "two.sided"))

	Wilcoxon rank sum exact test

data:  group_A and group_B
W = 1, p-value = 0.6667
alternative hypothesis: true location shift is not equal to 0
We can get the same result by using pwilcox, the accumulative probability distribution function of the above probability distribution plot with argument from 0 (for 3) to 4 (for 7). For group_A = c(2, 4) , the rank sum is 4, for which we assign the argument of 1. That is W = 1 in the printout. The p-value is
> pwilcox(q = 1, m = 2, n = 2)*2 # q = W, m: group_A size, n: group_B size
[1] 0.6666667
So, far, it was an extremely simple case, first, small sample size, second, there was no ties in ranks.
Bigger data sizes are not an issue as long as there are no ties. However, when there are ties, it would require a different approach.
Signed rank test
This is when the data points can be paired. This can be seen as a special case of rank sum test (?).